Vector Data Analysis
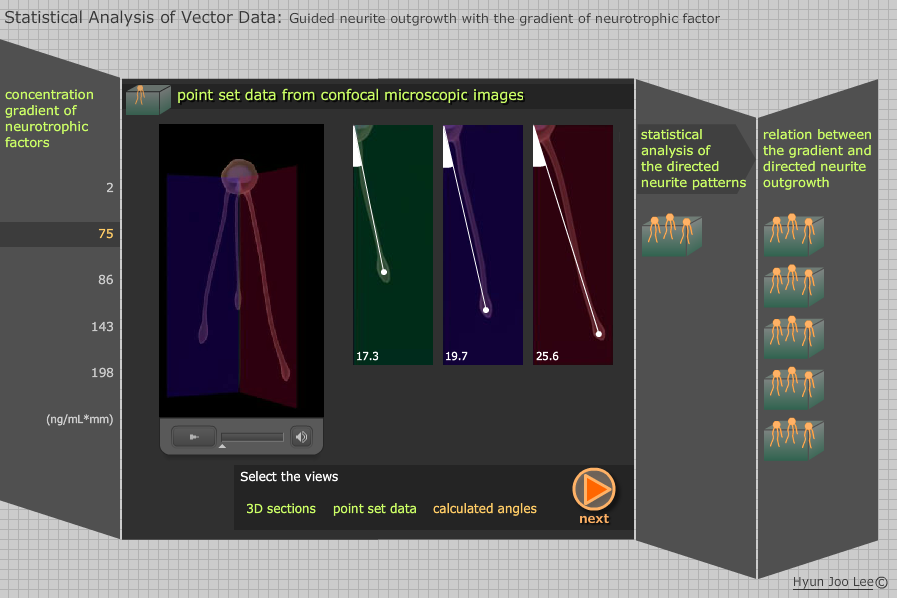
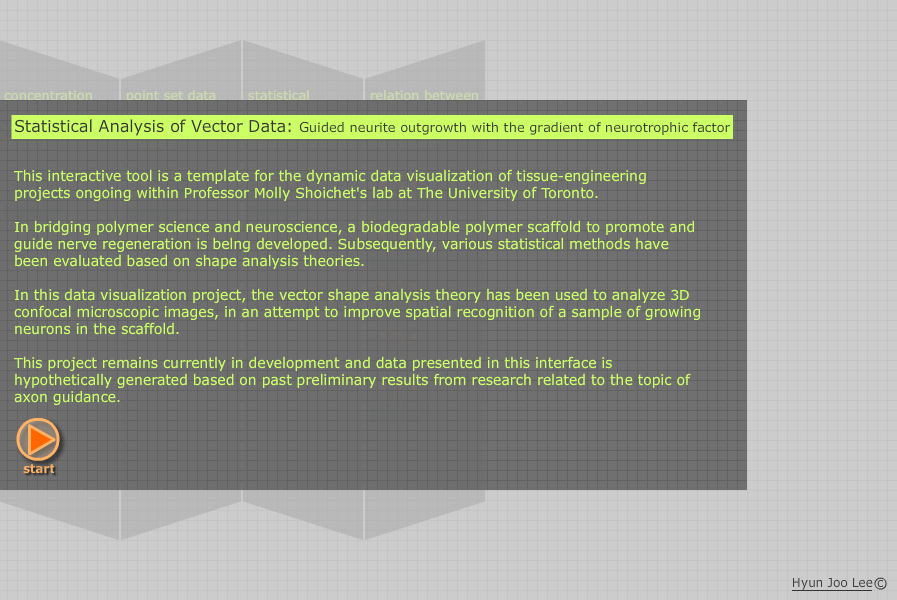
“Vector Data Analysis” is an interactive module simulating the analysis of three-dimensional data of axonal growth. This prototype design was developed to complement the animation “Across the Gap”. Visit Vector Data Analysis.
The Challenge
Axonal guidance research for medical treatment is a complex topic involving scientists from various fields. It is challenging to explain how organic cell growth in 3D space is statistically analyzed. While “Across the Gap” successfully conveys the story, animations generally have limitation for further education due to their time limits.
The Objective
The goal was to create an intuitive module that draws upon interaction design and user experience to stimulate the learning process and breaks up scientific processes into digestible segments.
The Approach
Interactive learning is known to increase knowledge comprehension and retention. In this project, the content was broken by the data analysis process so that users can understand the overall process at their own pace.
The interface design was inspired by Asian folding screens, which have multiple planes and can be folded and expanded depending on the purpose. Here, each plane reveals how vector data sets are obtained and analyzed from growing axons.
Data presented in this interface was based on preliminary results from the Shoichet lab at the University of Toronto.


