 For your information, this visualization was developed for printing. Please click the image above to view it in a better resolution.
Challenge
This malaria topic came from a larger global health education project for University of Toronto. Compared to other global health topics, malaria control presents a more complex history. Therefore, a visualization presenting the historical and current effort to eliminate malaria could benefit various stakeholders in the public sector including policy makers. As well, an engaging visualization could also raise awareness on malaria among the public, especially post-secondary students.
Content
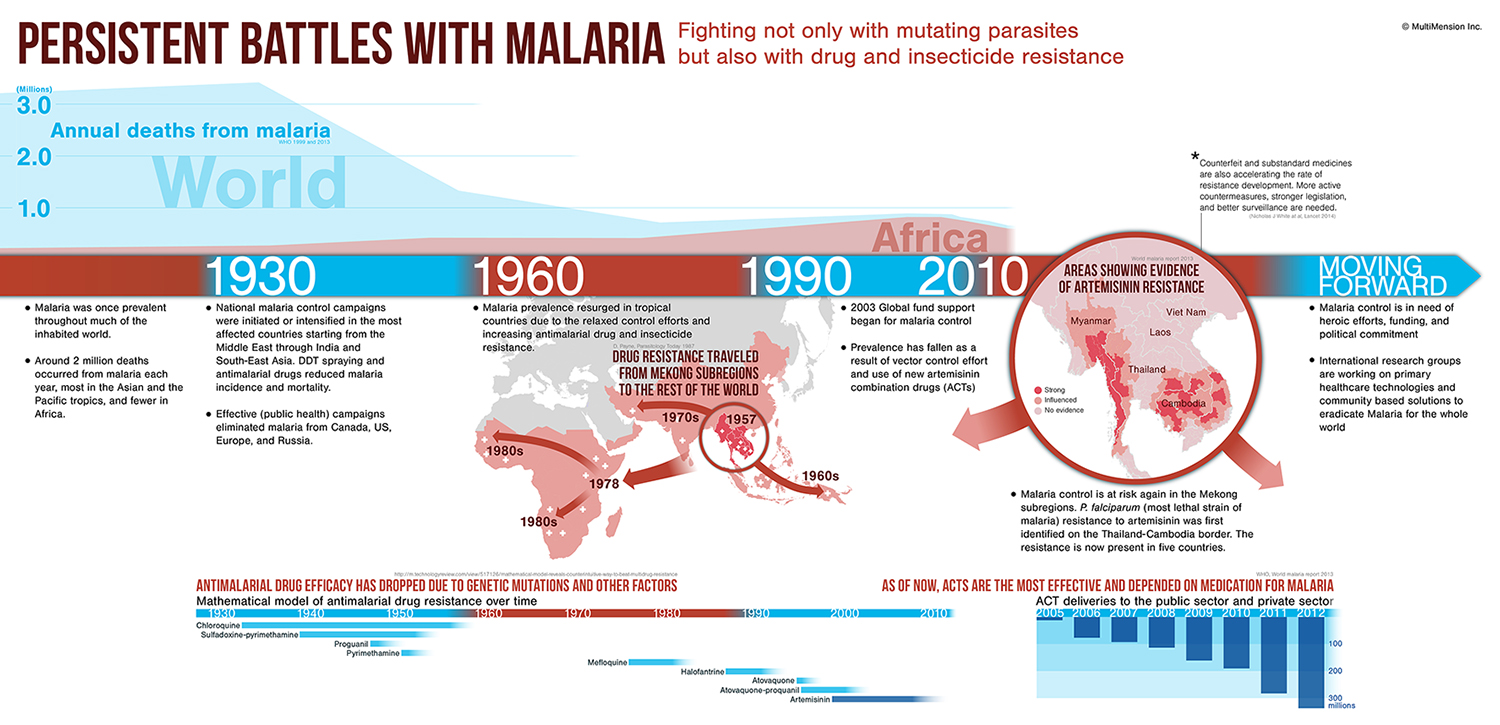
The constant struggle with malaria control existed for several decades since the rapidly evolving parasite continues to resist drug and insecticides. Previously, widely used malaria medicines became ineffective due to resistance, and the resistance travelled from the Greater Mekong sub-region to the rest of the world.
Artemisinin combination therapy (ACTs) is the most current, widely used and effective drug intervention in decreasing incidence and mortality rates of malaria around the world. However, resistance to ATCs were discovered in the parasites of the Greater Mekong region, presenting a new major global battlefront.
Approach
We came up with the layout based on timelines and color to convey the complex history of malaria control. The timeline progression guides the readers through the flow of data presented. The timeline also helps readers to organize a history of malaria control through macro level patterns and detailed information.
The annual death graph aligned with the drug resistance graph naturally reveals the relationship between malaria re-surge and the increased drug resistance. The two contrasting colours, red and blue, code ups and downs in malaria control over the years.
Conclusion
The visualization tells the story of the battle with malaria and the current challenges faced with emerging resistance to ACTs, the most widely used anti-malaria drug in the world.
We hope that this infographic will aid communication among researchers to encourage collaboration and improve the quality of decision-making. As well, we plan to use this visualization within a larger education module to engage students with scientific content.