Across the Gap
“Across the Gap” is a 3D animation depicting an axon guidance system with a tissue-engineered scaffold. Researchers in tissue engineering wanted to visualize their innovative strategy of using axon guidance for the treatment of the spinal cord injury.
The Challenge
Explaining the interaction between cells and the chemical components of tissue engineering is difficult due to their dynamic movement and morphological changes over time. The biggest challenge was visualizing the regrowth of axons in three-dimensional space over time. At that time, scientists were using 2D photographs to analyze the growing patterns of the axons. The lack of in-depth visual tools causes communication problems among neuroscientists and bioengineers.
The Objectives
1) To create an effective storyline about the scientific research to facilitate communication among researchers and other stakeholders.
2) To design a variety of graphic devices based on mathematics and topography to promote viewers’ spatial understanding and data analysis .
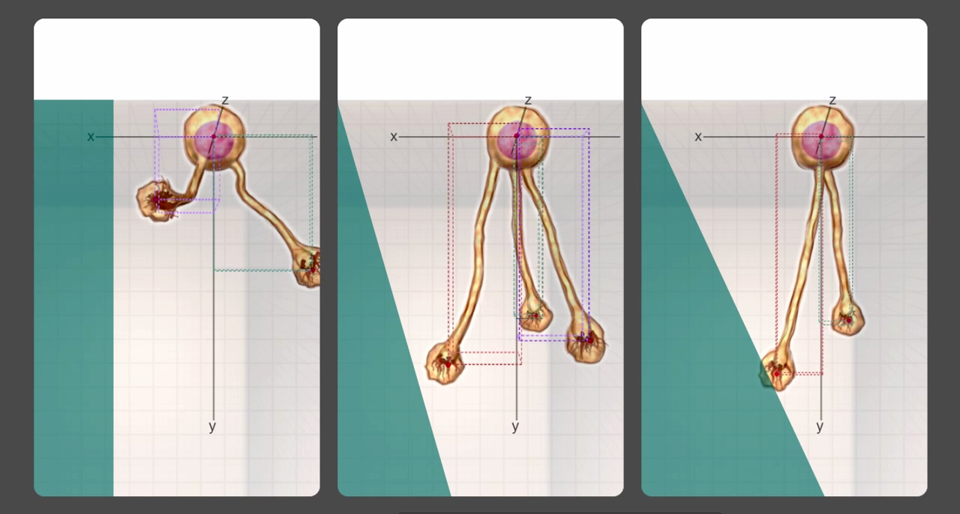
This diagram shows the production plan for the project.

Our Approach
In this animation, graphic devices such as arrows, guidelines and grids, inspired by topography and mathematical coordinate systems, are applied to guide viewers. Growing axons are symbolized as 3D geometric shapes to represent the consistent pattern of the axonal growth. In addition, the collection of geometrical information simulates how statistical shape analysis can be used to analyze the data.
The Outcome
This project has been beneficial to scientists and students in bioengineering, chemistry, and medical sciences due to its lucid ability to explain a complex research area. The animation has been shown numerous times at conferences, in broadcasting, and online. It has been also used as a good data visualization reference for designers and medical communicators.This project also lead me to develop an data visualization interface prototype: Vector Data Analysis