Metrics for mobile apps Part 1: fundamentals
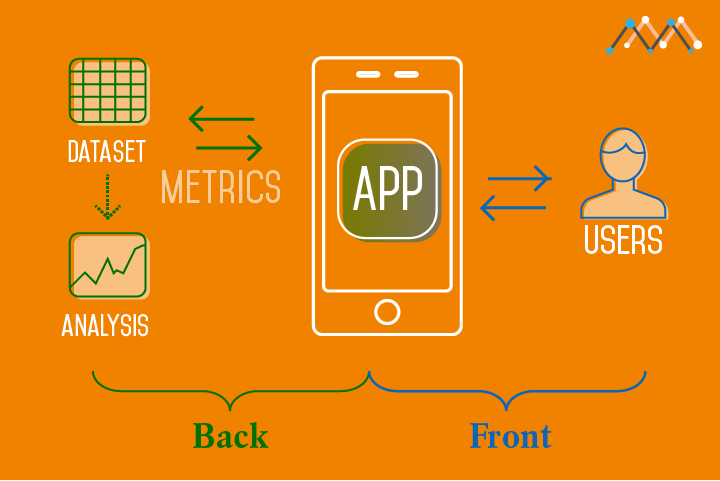
We’ve worked hard on planning and producing mobile apps, and now we’re focusing our energy to evaluate them. We’ve organized basic metrics for mobile apps, then came up with customized metrics for in-depth evaluation. These are the metrics that are applicable to any mobile apps.
- Who are the users?
- Who is using the app and how they’re using it: demographics, devices, time of the use during the day.
- Active users: Those who use the app regularly. For example, your monthly active users (MAU) or daily active users (DAU). New vs. active users will distinguish between the growth rate of the user base and the loyalty of users
- User acquisition: Where do users come from? Whether through organic search, paid advertisements, in-app referrals or word-of-mouth, user acquisition will show the best way to reach your target audience.
- How much time users spend in the app?
- Session length: Just like pageviews vs. time spent on the web, session length on an app can help mobile strategists quantify the depth of a person’s relationship with an app. Once the user opens up the app, the app begins tracking around the 2 minute mark. Apps can also be configured to start tracking at other intervals, like 5 minutes instead of two. Many sites advise app creators to avoid tracking seconds because it creates heavy (and unnecessary) traffic.
- Retention rate: specifically seven and 30-day retention rates. “Retention is one of the biggest challenges of mobile apps today, as 65% of people stop using them three months after install”. Plus, app store rankings are becoming more sophisticated and focus more on retention and engagement.
- Do users enjoy using the app?
- App launch / load time: Users should be able to launch the app, load new pages and make purchases seamlessly without thinking.
- User experience: It’s important to get feedback about crashes, bugs and UI using feedback to enhance the user’s experience.
- Many app creators would use the term “sticky”/sticky-ness when discussing user retention and experience. A “sticky” app motivate users return to it, use and check it. Some examples include the Starbucks app, where customers are rewarded with discounts after using the app a certain number of times, and popular gaming apps Candy Crush and TwoDots.
- Does your app contribute to revenue creation?
- The average revenue per user indicates the value of an individual to your app business. “Revenue” will be based on the app’s price and/or in-app purchases and conversions.
The part 2: customized metrics continues in http://www.multimension.com/2014/09/25/metrics-mobile-apps-part-2-customized/
1 Comment
MultiMension Metrics for mobile apps Part 2: customized
November 26, 2014[…] In case you haven’t read part 1. fundamental metrics: http://www.multimension.com/2014/09/25/metrics-for-mobile-apps-part-1-fundamentals/ […]